Montgomery County Tackles Heat Inequity through Heat Mapping Campaign
By Maya Wiese, Environmental Leader
In the summer of 2022, Montgomery County was selected to participate in the National Oceanic and Atmospheric Administration’s (NOAA) “Urban Heat Mapping Campaign” to map the temperature of a 200-square-mile area as part of a larger project to find solutions to the county’s urban heat islands. Neighborhoods involved in the project include areas like Bethesda, Gaithersburg, Germantown, Rockville, Silver Spring, and Wheaton. Extreme heat is more lethal than any other weather event and is especially dangerous for seniors, infants, outdoor workers, people with pre-existing health conditions, and people without access to air conditioning.
 (Campbell) https://storymaps.arcgis.com/stories/389babe7ce654fdd87701488ae72e8b6
Heat exhaustion can lead directly to heatstroke, dehydration, and heart issues. This means identifying heat islands could be a life-saving task. An urban heat island occurs when a city experiences higher temperatures than more rural or tree-covered areas because buildings and roads absorb sunlight. Vulnerable neighborhoods disproportionately include those who have the least access to financial resources, underserved communities, and those struggling with other health conditions.
How do you map heat?
The Montgomery County heat mapping campaign was completed on August 7, 2022, which was a predetermined, particularly hot day. 135 volunteers drove 19 pre-planned routes with sensors detecting the surrounding temperature and humidity attached to their cars. These car sensors are able to collect data more accurately than satellites. Volunteers traversed these routes three different times during the day, 6am, 3pm, and 7pm, to track the temperature changes over the course of the day.
What did they find?
 https://osf.io/pk7uw?view_only=003a354126284c2298ec365424fac4b3
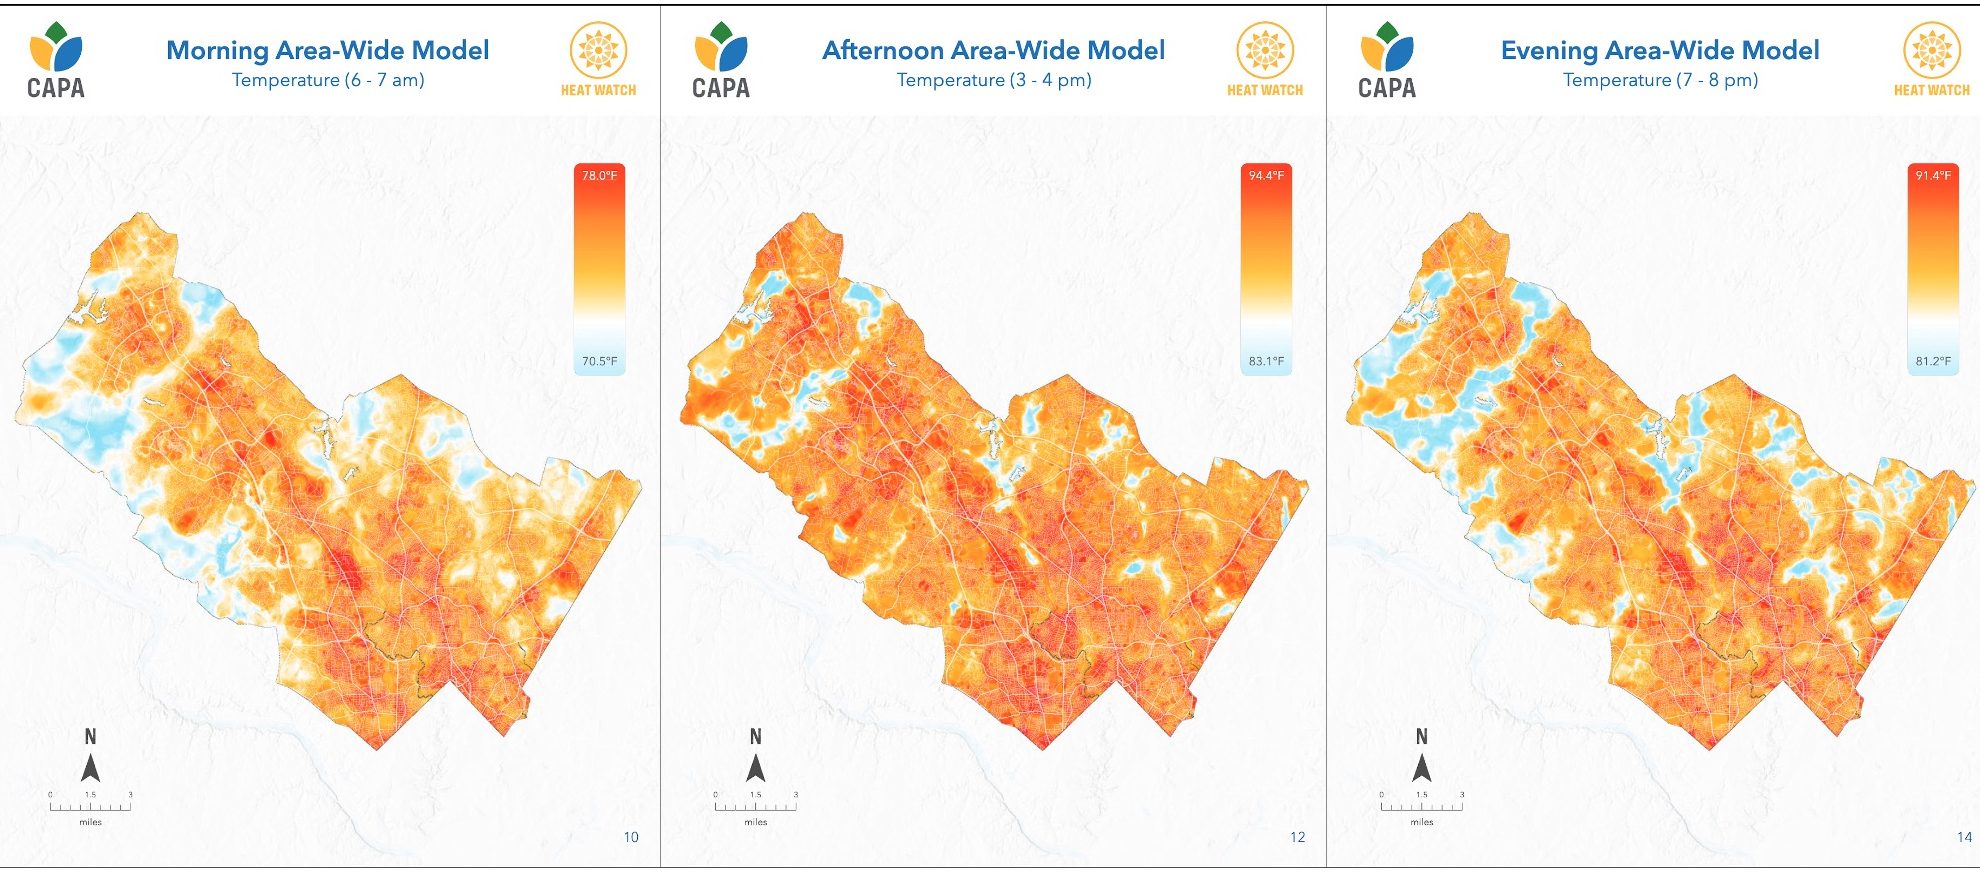
The data recorded a max temperature of 95.6°F and 12.8°F temperature differential between the hottest and coolest areas traversed. The Area-Wide Models demonstrate an accumulation of heat in southeastern Montgomery County closer to D.C. where there is more development as well as a high population density. The data found that temperature was significantly higher in highly developed areas and commercial centers. Areas with developments like streets, parking lots, and buildings accumulate heat and spill excess into nearby residential areas. Preserved natural areas with high percent canopy cover stayed cooler throughout the day. Trees and vegetation can help reduce heat by providing shade and releasing moisture into the atmosphere (Campbell). Temperatures are rising fast. According to Montgomery County’s report on “Community Heat Mapping in Montgomery County”, by 2035 there will be an “average of 12 days each year with temperatures reaching above 95°F, three times more than the County is experiencing today.” As shown on the Area-Wide Model, Bethesda, North Bethesda, Rockville, Gaithersburg, and Germantown are the urban centers the most impacted by the heat island effect and could see the most damage from rising heat in the future.
What’s next?
With heat islands now identified, Montgomery County hopes to spread information to community members and put measures in place to help protect those at risk. The County will use data derived from the project to shape programs for vulnerable groups like seniors, people with disabilities, and those experiencing homelessness or who spend a significant amount of time outside. The County is also working with programs like Thriving Earth Exchange to prioritize tree planting to increase canopy cover and identify possible locations for cooling centers. They will also work to develop stronger tree protection measures on public and private lands and implement other heat-management strategies. Long-term strategies for the heat and carbon crisis include sustainable planning and design, environmental management, and adapted engineering practices, promoting adaptation and mitigation. Laura Sivels from the Montgomery County Department of Environmental Protection, Project Coordinator for the heat mapping project explains in an interview that the resulting maps are already answering questions from county staff about projects, “whether it’s more green spaces or even looking at our bus shelters or transportation infrastructure and how we can make sure people are staying cooler.”
But Montgomery County is not tackling this project alone. Instead, they aim to engage environmental programs and community members within impacted areas to spread awareness about heat safety. “The biggest goal is that we could work to reduce [heat differential] through tree coverage, green space, and things like that” and additionally be able to “provide people with the pathways they need to connect with cooling centers and knowing which libraries they can go to that have free air conditioning, or when the buses have free water and things like that,” says Sivels. She also notes that the county is hoping to work with areas of worship and small businesses in the summer to encourage people to come to use their air conditioning. The maps are also able to help existing local environmental programs prioritize locations and actions based on the needs of the community. For example, Tree Montgomery is a program that plants trees on private property across the County. Based on the maps, “if they are in one of the higher heat areas then they have a higher priority to get a tree and they are doing more intentional outreach to get people to sign up for Tree Montgomery in those areas.” New data will help to push existing sustainable initiatives in places that are affected by extreme heat the most. Over the coming years, we will gradually see the implications of work from a government and community level to fight inequalities and dangers caused by heat throughout the county.
References
Campbell, K., & Tilmes, M. (n.d.). Community Heat Mapping in Montgomery County. ArcGIS StoryMaps. Retrieved March 9, 2023, from https://storymaps.arcgis.com/stories/389babe7ce654fdd87701488ae72e8b6
CAPA & NIHHIS. (2022, August 9). Heat Watch Montgomery County. OSF. Retrieved March 9, 2023, from https://osf.io/pk7uw?view_only=003a354126284c2298ec365424fac4b3
About the Author:

Maya Wiese, Walt Whitman High School, Class of 2023
Maya is excited to be an Environmental Leader this year to learn about sustainability and community organizing. In the next few years, she is hoping to study new energy technologies. She is also an avid soccer player, hiker, and graphic designer.