
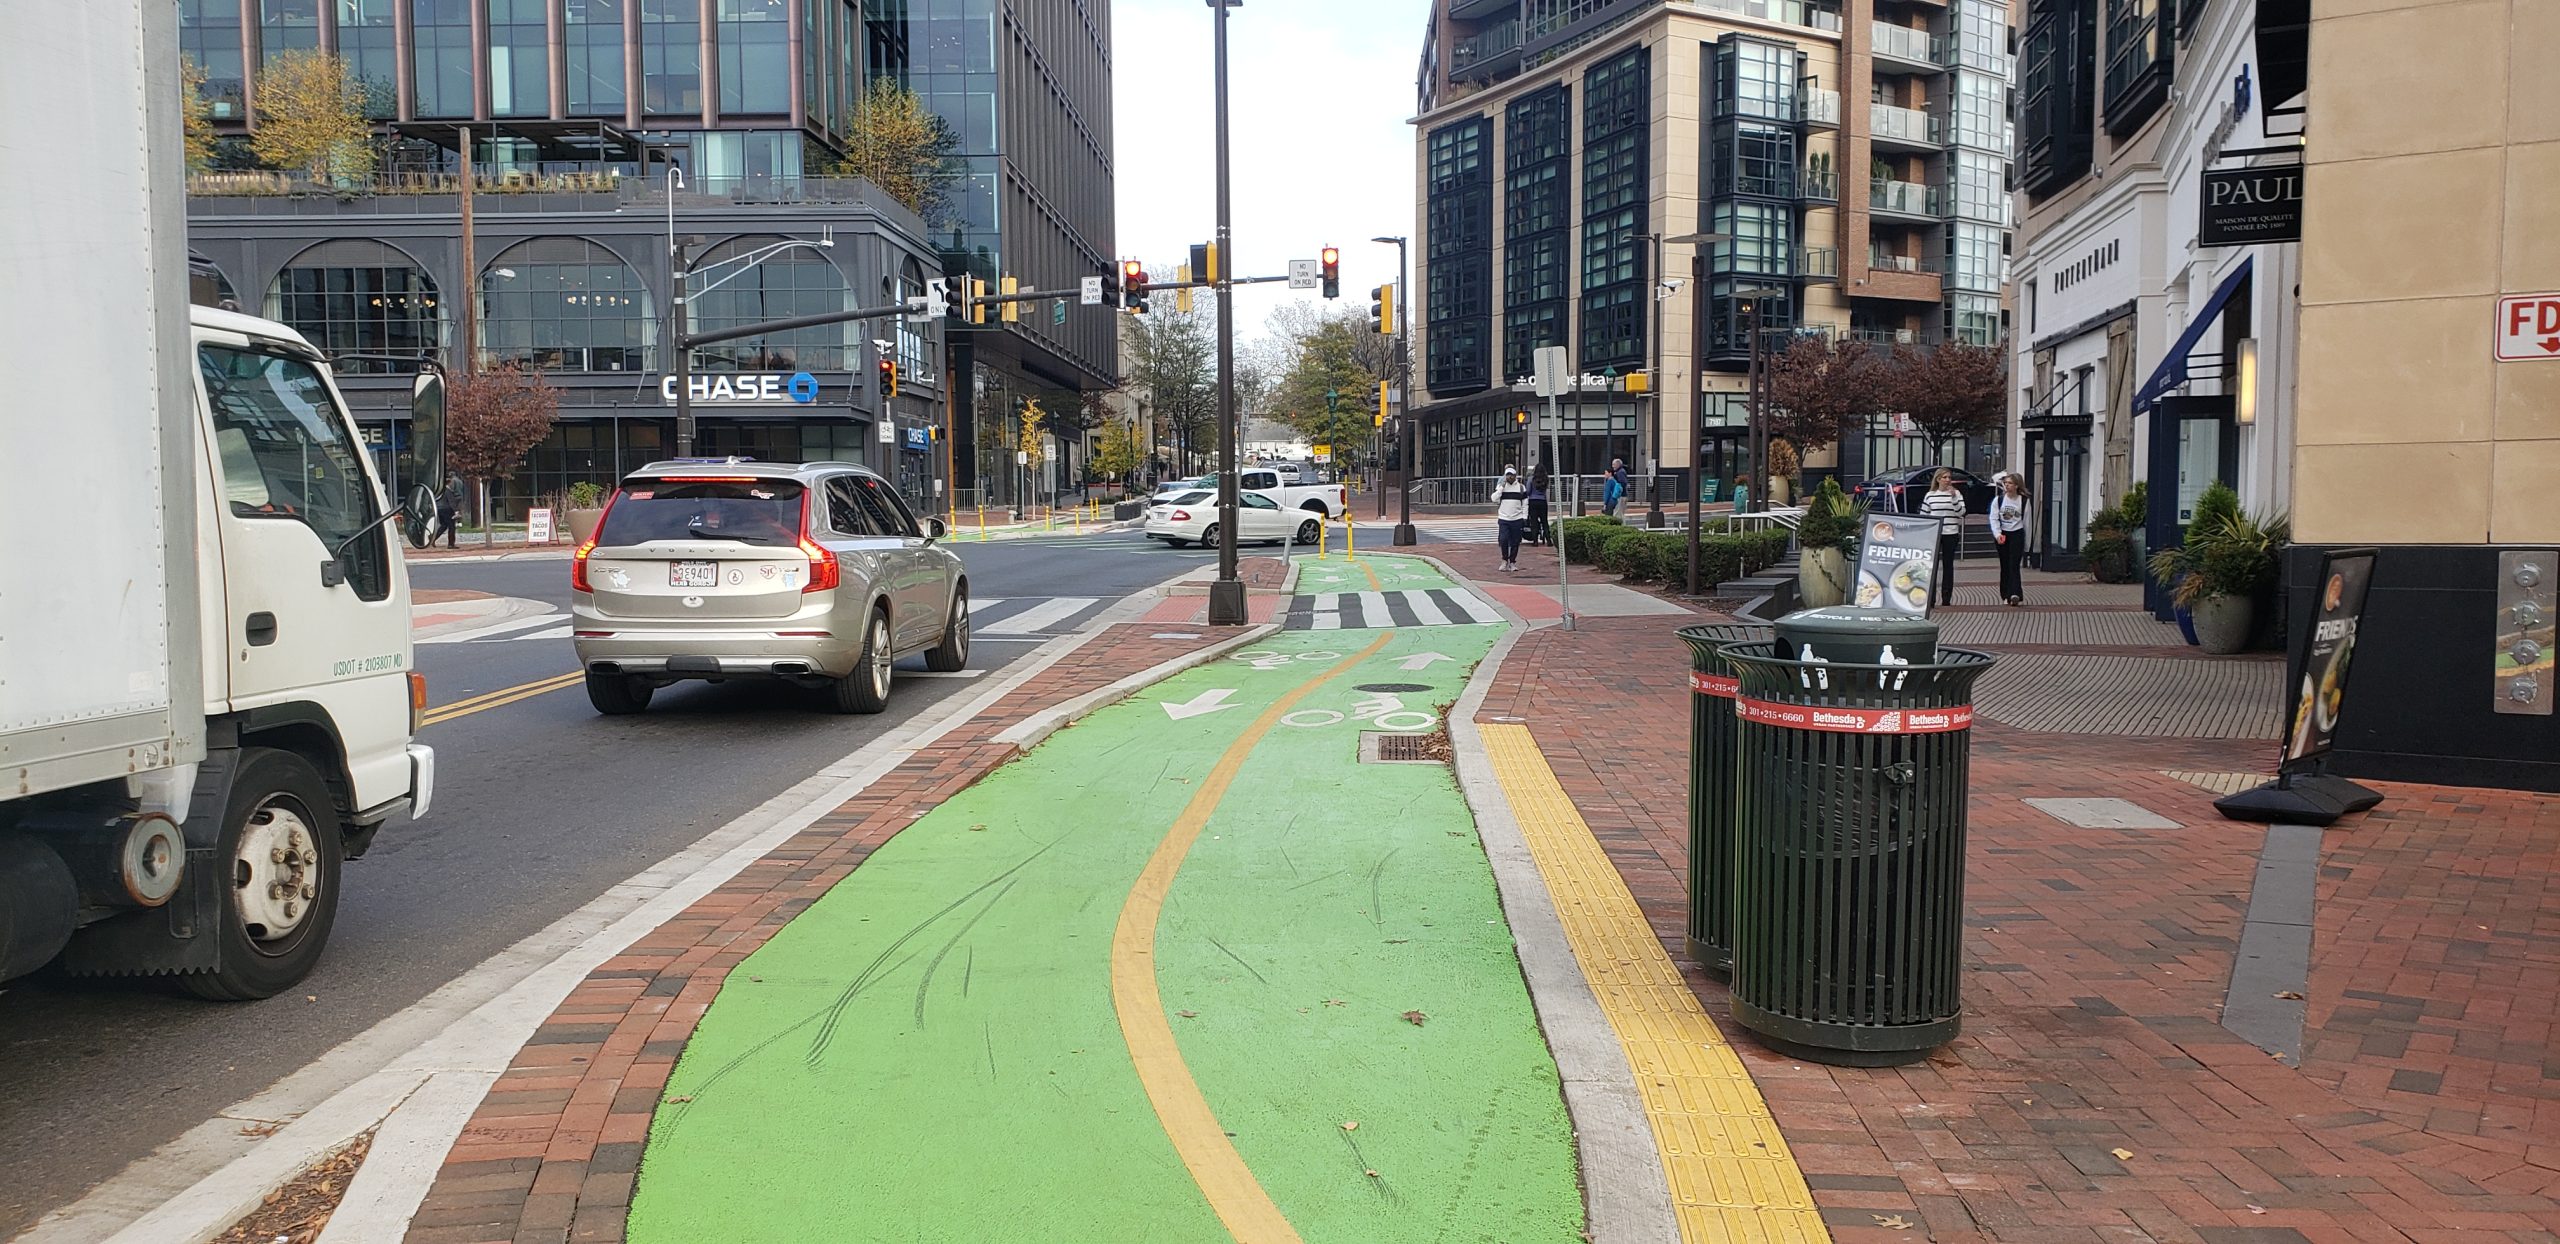
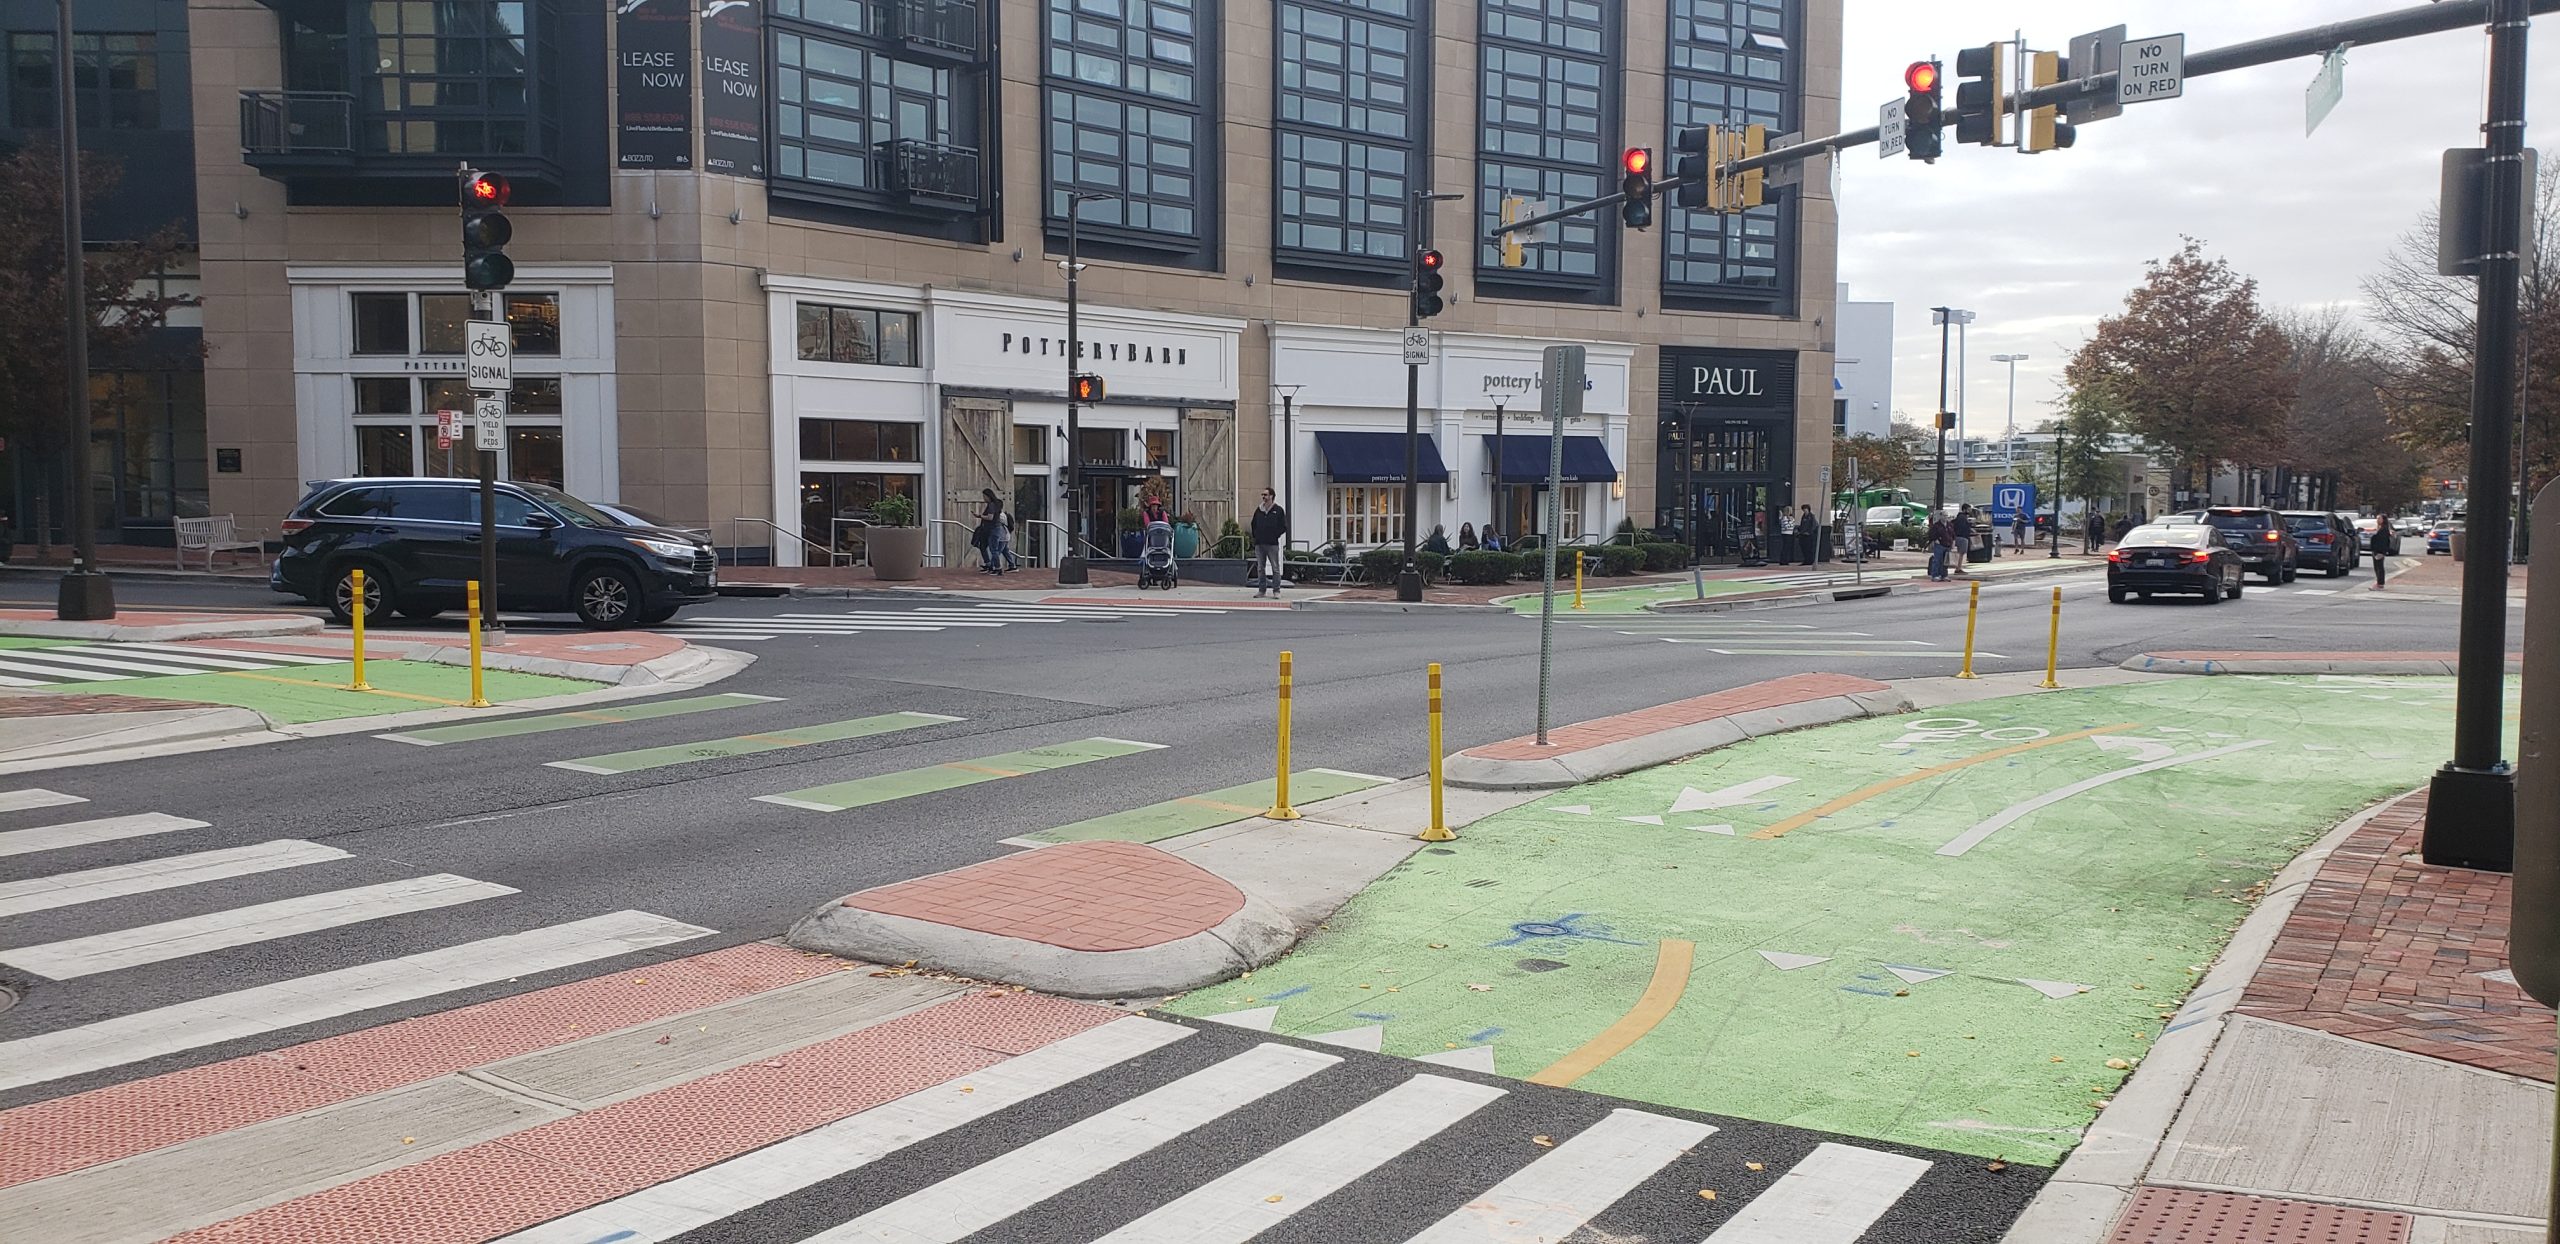
Image: A protected intersection in Bethesda Row.
Biking in Bethesda: What Does the Future Hold?
By Matthew Smith, 2022-2023 Environmental Leader
If you’ve been around Bethesda Row at all lately, you’ll probably have seen the brand new two-way protected bike lanes pop up: they’re separated from traffic with concrete, painted a bright green at intersections, and, most noticeably, not very well traveled. Despite construction having been in progress since November 2020 (Bethesda Bikeway and Pedestrian Facilities, n.d.) and a total funding of $12.45M (Montgomery County Maryland Capital Budget, 2022), biking remains one of the least popular ways to traverse Bethesda, with only 2.28% commuting via. bicycle as of 2020 (Bethesda, MD | Data USA, 2020). With the low amount of use, high cost, and seemingly endless construction, we are led to ask one question: “Are these bike lanes really worth it?” To really answer this question, we have to look at the pros, cons, and, as the title suggests, what the future holds.
A strip of protected bikeway in Bethesda Row.
The main benefit of the bikeways is that they are a drastic improvement over a bicyclist’s previous two options- ride in the road, or ride on the sidewalk. When riding in the road, you are surrounded by fast-moving, heavy vehicles, an environment ripe for collisions and miscommunication. Fatality rates for cyclists who ride in the road are appalling, with almost 1,000 dying and over 130,000 being injured every year (Bicycle Safety | Transportation Safety | Injury Center | CDC, 2022). On the sidewalks, bicyclists are much safer, but must navigate around pedestrians, who can emerge from doorways without warning and are much slower than your average cyclist. On sidewalks, 33.8% of pedestrians experience a near collision with a cyclist (Mesimäki & Luoma, 2021). Additionally, the sidewalks are usually bumpy, making cycling unpleasant. Bike lanes create a strong list of pros by directly addressing these concerns. In separated lanes, cyclists are permitted to go as fast as they please, and do not have to worry about dodging cars or pedestrians. The concrete curbs keep cyclists safe, while the clear markings make sure that only bikes use the space. Two-way, separated bikeways have been proven to produce a 28% reduction in cyclist injury rate (Lusk et al., 2011).
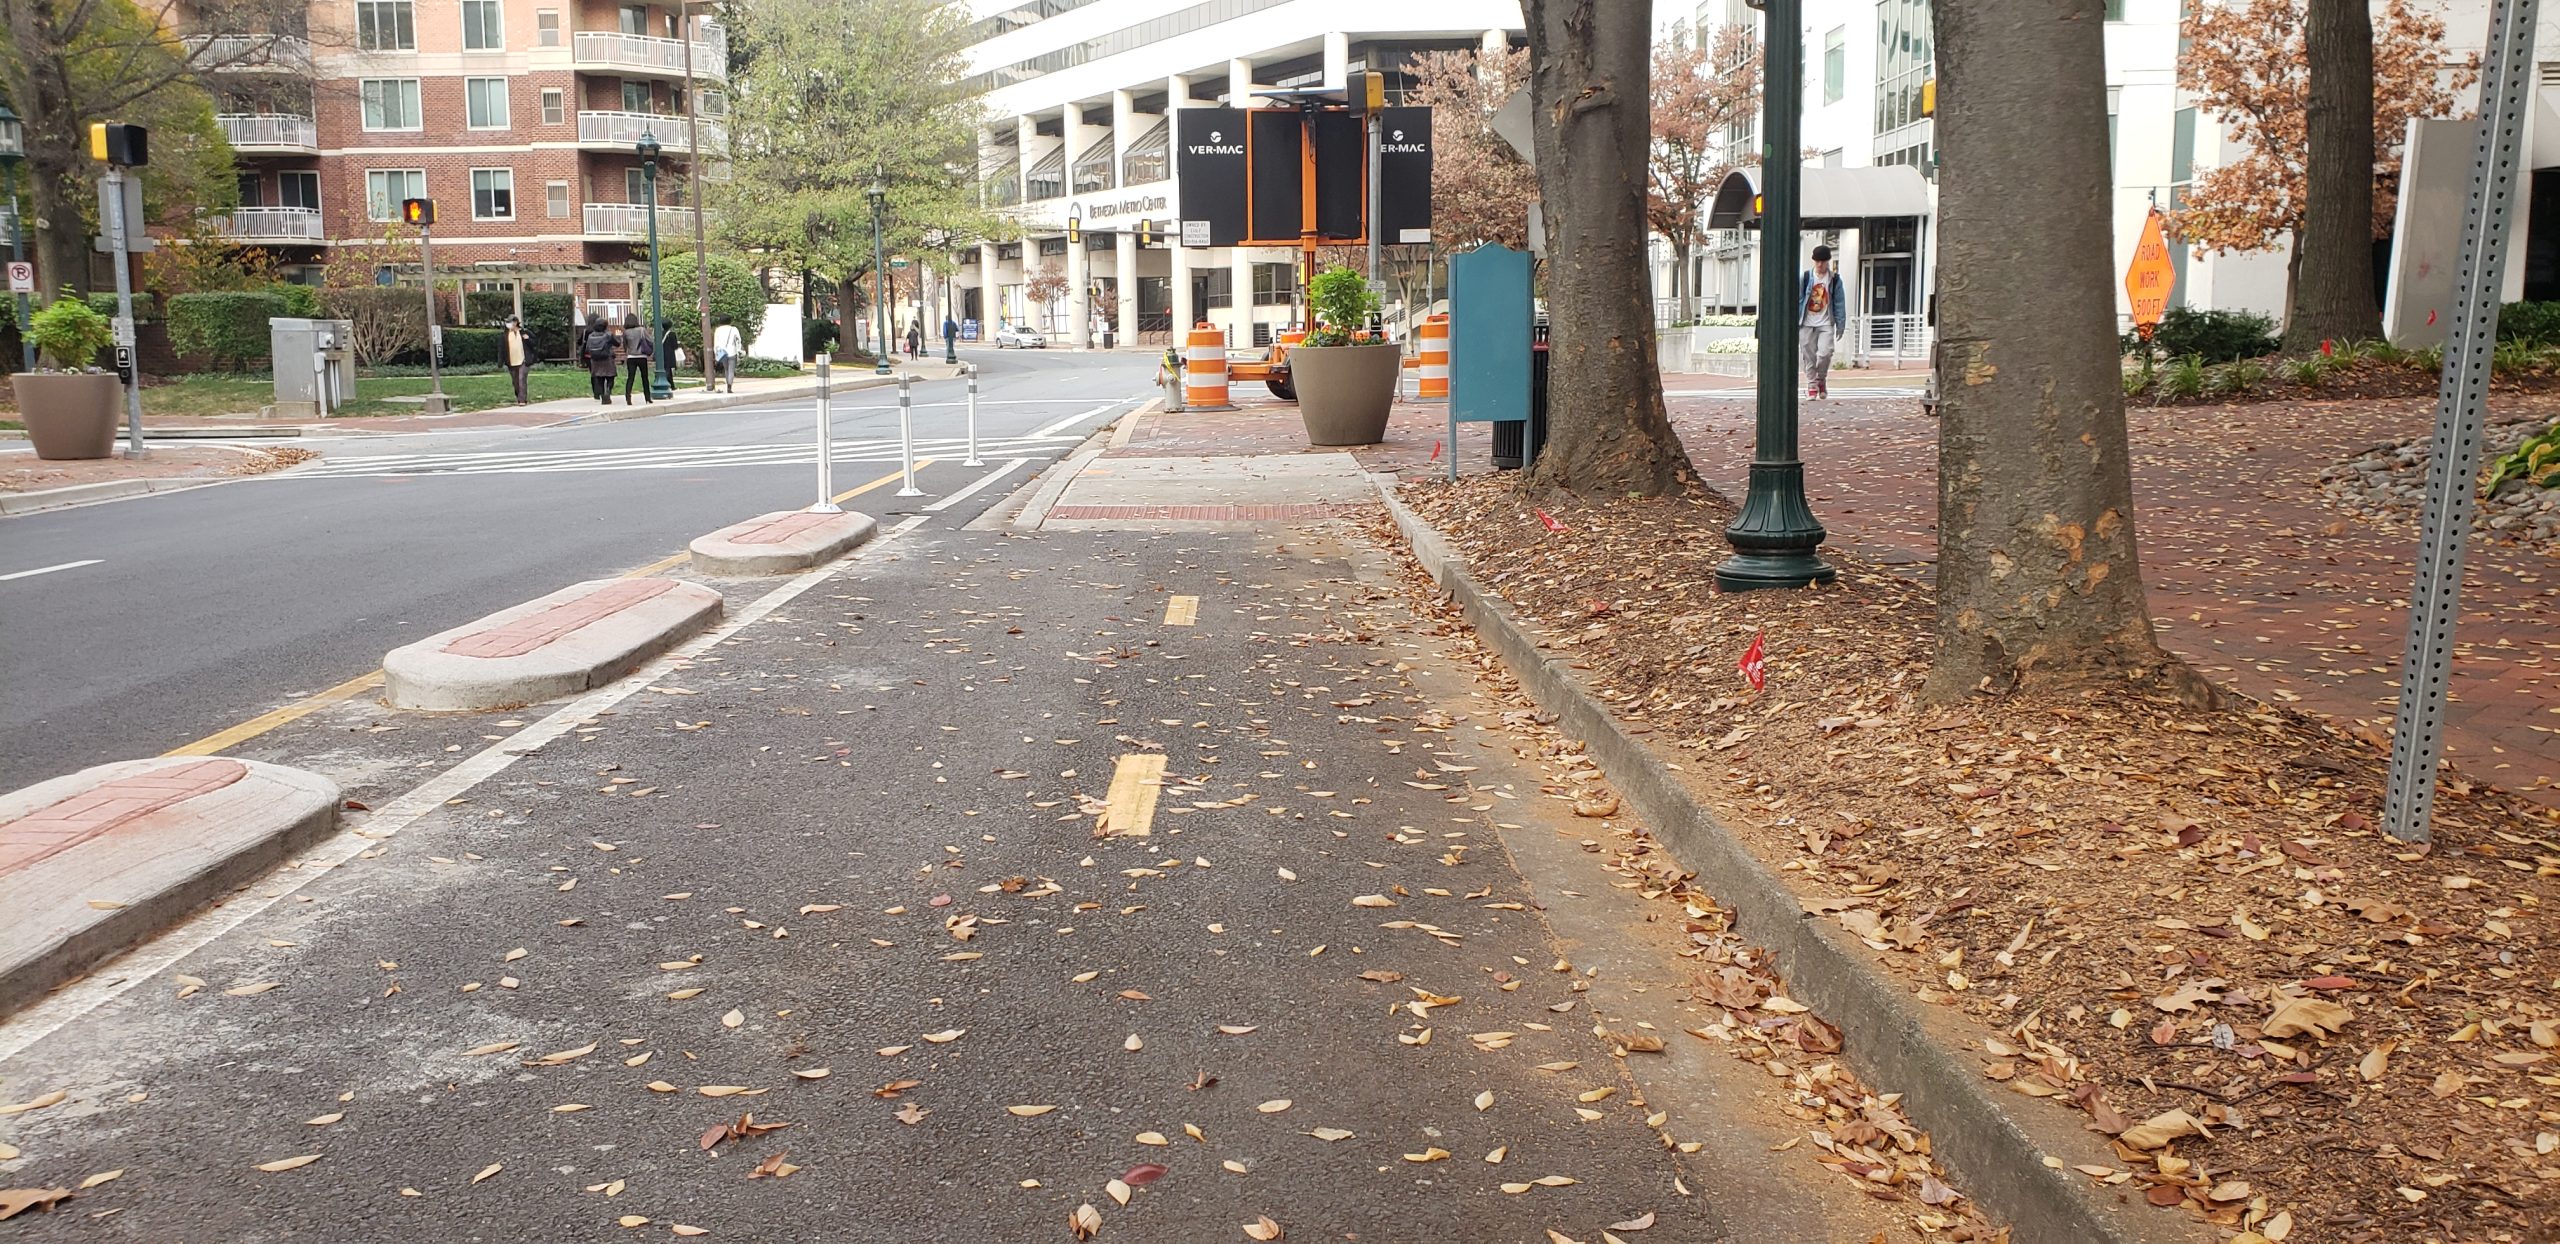
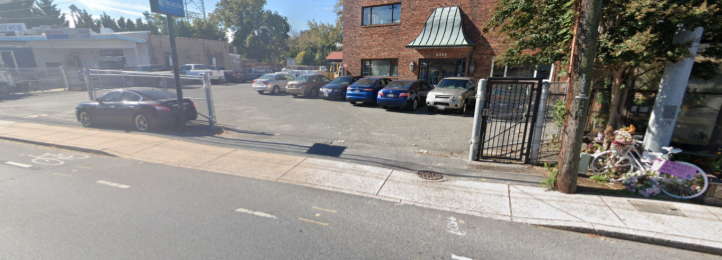
A dead end just before the Bethesda Metro Center.
While being a drastic improvement over the infrastructure previously available to cyclists, the lanes still have some flaws. First of all, the lanes are quite narrow. Measuring at just 5’ per lane, passing cyclists moving in the opposite direction can be uncomfortable, especially when accounting for the fact that the street gutter takes up about a foot of the lane nearest the sidewalk (Bethesda Bikeway and Pedestrian Facilities, n.d.). The biggest flaw in these bike lanes, which happens to be the root cause of sparse use, is that they are not connected. Moving up Woodmont Avenue, the bikeway abruptly disappears, dumping users onto the sidewalk. To make matters worse, the bikeway ends just before reaching the metro center, a transit hub that desperately needs a better bike connection. Floating bikeways exist without any connection on Montgomery Avenue as well as Woodmont, further pushing the infrastructure to become less useful for a larger number of trips. Luckily, this problem already has a solution. The issue is, we simply have to wait.

A map of planned bikeways overlaid with existing disconnections (Bethesda Bikeway and Pedestrian Facilities).
Under the “Bethesda Bikeway and Pedestrian Facilities” tab of the MCDOT website, we can view the map of planned bikeway construction and see that all of the existing, disconnected infrastructure will eventually be joined together in one large line with various offshoots (Bethesda Bikeway and Pedestrian Facilities, n.d.). The abrupt stop witnessed while traveling down Woodmont? Gone in early 2023, finally connecting to the standalone lanes past Old Georgetown Road. The random segment on Montgomery Avenue? Supposedly connected in the summer of 2022, however the actual date isn’t clear yet. So, even though the lanes seem sporadic and disconnected for the moment, they will actually be joined in the coming years. This will solve one of the biggest problems plaguing the current infrastructure- low ridership.
How can we say for sure that connection is the key to ridership? Our answer lies in the town of Oss, Netherlands, one of many cities in the country with outstanding cycle friendliness. With a population of 76,430 as of 2022 (Population of Cities in Netherlands 2022, 2022), and total area of 13.23 mi² (Oss · Netherlands, n.d.), Oss is comparable to Bethesda’s 69,496 and total area of 13.3 mi² (Bethesda, Maryland Population 2022, 2022). Despite the similar populations, the quality of Oss’ cycling infrastructure is lightyears above Bethesda’s.
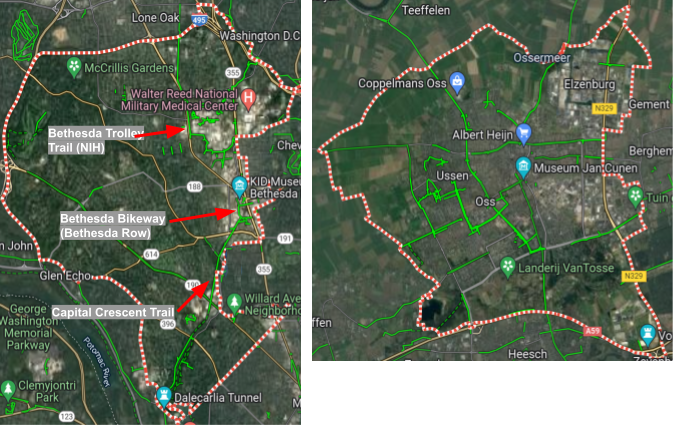
A map of cycling infrastructure in Bethesda (left) and Oss (right). (Google Maps)
Oss’s superior infrastructure can be seen in the maps above, where each green line is a piece of bike friendly infrastructure (trails, protected lanes, etc.). Based on the maps above, we can see that Bethesda’s cycling infrastructure is sparse and inconsistent, while the cycling infrastructure in Oss offers a more evenly distributed coverage of the city. As a result, bike infrastructure in Oss has many connections, allowing cyclists easy access to the entire network. When viewing the map of Bethesda’s cycle infrastructure, we see clusters of infrastructure that are disconnected from each other as well as from the rest of the city. The Bethesda Bikeway in Bethesda Row is only connected to the Capital Crescent, while very few points of access are provided to the Bethesda Trolley Trail at NIH. If you wanted to get to the “Museum Jan Cunen” in Oss via bike, you could do so from almost anywhere in the city without having to cycle on a sidewalk or road. However, if you wanted to reach the Kid Museum in Bethesda on bike infrastructure alone, you would be restricted to using the bike lane on River Road and Capital Crescent trail. Imagine if there were only roads that went to Bethesda Row- a huge portion of the city would be cut off from even accessing the area, simply because of the lack of coverage. This is the exact situation with bike infrastructure; if someone is on a bike, they are immediately limited in the number of areas they can safely access due to the scarcity of infrastructure built to accommodate them.

A protected and separated intersection in Oss, featuring a crossing island. (Google Maps)
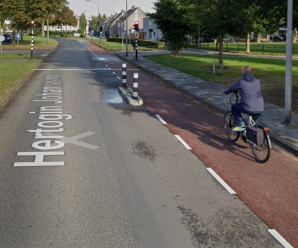
A painted bikeway in Oss (Google Maps).
Oss also excels in providing bike infrastructure that is of high quality. Google Street View reveals that protected bikeways make up the majority of Oss’ cycling infrastructure. Within this type of bikeway, a safe separation from cars is achieved through a grassy median, while pedestrians are kept out of harm’s way with a clear difference in paving material and color. In Oss, even the painted lanes, which are widely considered the worst iteration of cycling infrastructure, appear comfortable. As can be seen in the image, they provide ample space for cyclists and run along slow, narrow, one-lane roads, where traffic is less dangerous due to its reduced speeds and total volume.
When compared to Bethesda’s infrastructure, we can see some bicycle ways of similar quality. The Bethesda Bikeways intersection in Bethesda Row is equally as good as the intersection showcased from Oss; it has protected bike lanes, clear marking, and slower traffic. Another example of quality infrastructure can be seen in the protected riding space provided by the Capital Crescent and Bethesda Trolley trails. The main shortcoming of these trails is that pedestrian and cyclist traffic is mixed, resulting in cyclists being slowed by those walking ahead of them. If they want to pass, cyclists must enter the left lane, which can be dangerous when pedestrian and cycle traffic is moving in the opposite direction. Overall, these trails lack the pedestrian-bike separation that makes cycling fast and safe.

A painted bike lane on River Road comes to an abrupt stop before a busy intersection. (Google Maps)
The most dangerous piece of Bethesda bicycle infrastructure is, without a doubt, the painted lanes running alongside River Road. While painted lanes in Oss were situated along single lanes of slow traffic, we can see that cyclists on River Road are expected to ride alongside two lanes of 35 mile per hour traffic, roughly three times the speed of an average cyclist (Gavin, 2020). While this is unsafe in itself, the painted lanes also regularly disappear at every intersection, forcing the cyclist to merge into the busy car traffic in order to continue onward. River Road’s dangerous cycling environment has had very real and tragic consequences: in August of last year, a cyclist died while riding in the bike lane, simply because the driver didn’t check before making a right turn (Schere, 2022).
The approximate location where the crash occurred. On the right, a memorial for the late victim can be seen. The pink sign reads, “A bicyclist was killed here” (Google Maps)
Oss’ safer and more convenient cycling network promotes an astounding rate of ridership within the city. According to commute statistics from the Netherlands, 29% of Dutch commuters cycle to work (Netherlands: Modes of Transport Used to Commute to Work | Statista, 2019). Compare this statistic to the 2.28% of Bethesdians do the same, and it is clear that bikeway quality, connectivity, and safety is the key to a high bicycle ridership.
Of course, factors aside from infrastructure quality and connectivity can impact people’s willingness to bike. Effort required, for example, is routinely listed as one of biggest deterrents to non-cyclists (Cleland & Walton, 2004). With this in mind, one might pin the Netherlands’ high cycle ridership on its famously flat terrain (Burger, 2022) rather than its advanced cycling infrastructure. This belief, however, can easily be dispelled when examining cycling statistics from Los Angeles, the hilliest city in the US (Rasmussen, 2021). If hilliness were a major factor in determining a city’s cycling prominence, then we would expect the number of Los Angeles cyclists to stay low regardless of infrastructure size and quality. However, when the city grew the bikeway network by 130% between 2005-2015, the number of cycling trips more than doubled, growing by 114% (Pucher & Buehler, 2016). Over the same period of time, LA’s population only grew by 3.15%, marking an insignificant portion of new riders (Los Angeles – Place Explorer – Data Commons, 2021). As the saying goes, “If you build it, they will come”. This rings true with bike infrastructure, even if you build it in the hilliest city in the entirety of the United States.
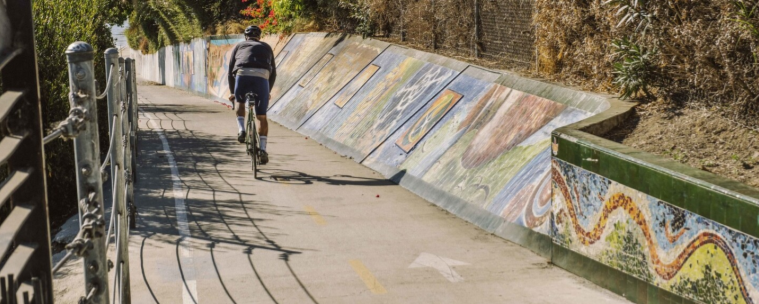
A bike trail in Los Angeles. (Tinoco, 2019)
To further prove that high rates of cycling are possible in Bethesda, we can look at the statistics of DC, a city with extremely similar topography that is just 6.19 miles from our own (Distance Between Bethesda, MD and Washington, DC, 2022). Over the course of 2000-2015, DC’s bikeway network grew 101% (Pucher & Buehler, 2016). The expanded infrastructure was accompanied by a staggering 384% growth in cycle trips, while the city’s population only grew by 14.9% (Gilmore, 2014). It is clear that people are willing to cycle, regardless of their terrain. All that it takes for a city to become bike-friendly is infrastructure that makes cycling convenient, comfortable, and safe.

An overhead image of US-19 in Florida, a road notorious for its lack of pedestrian and cyclist safety. (Cogan, 2022)
While Bethesda is certainly lagging behind in terms of bicycle infrastructure, it is still impressive when compared to the majority of North America, which is infamous for treating pedestrians and cyclists as second-class citizens. In order to achieve the low-carbon, healthy lifestyle that cycling promises, we need to advocate for appropriate cycling infrastructure and vote for the representatives that put people first. If we all became just a little more conscious of Bethesda’s need for safe cycling infrastructure, it could be assured that our city’s cycling future would be a bright one.
References
Bethesda Bikeway and Pedestrian Facilities. (n.d.). Bethesda Bikeway and Pedestrian Facilities. Retrieved December 11, 2022, from https://www.montgomerycountymd.gov/dot-dte/projects/bethesdabikewaypedfacilities/index.html
Bethesda, Maryland Population 2022. (2022). Bethesda, Maryland Population 2022. Retrieved December 11, 2022, from https://worldpopulationreview.com/us-cities/bethesda-md-population
Bethesda · Maryland, USA. (n.d.). Bethesda · Maryland, USA. Retrieved December 11, 2022, from https://www.google.com/maps/place/Bethesda,+MD/@38.9817225,-77.1886166,12z/data=!3m1!4b1!4m5!3m4!1s0x89b7cbb76a24022d:0x26b279f76a2bcd0d!8m2!3d38.984652!4d-77.0947092
Bethesda, MD | Data USA. (2020). Bethesda, MD | Data USA. Retrieved December 11, 2022, from https://datausa.io/profile/geo/bethesda-md/
Bicycle Safety | Transportation Safety | Injury Center | CDC. (2022, May 4). Bicycle Safety | Transportation Safety | Injury Center | CDC. Retrieved December 11, 2022, from https://www.cdc.gov/transportationsafety/bicycle/index.html#:~:text=Nearly%201%2C000%20bicyclists%20die%20and,the%20United%20States%20every%20year.
Burger, E. (2022, July 21). Why is the Netherlands so flat? The complete explanation. DutchReview. Retrieved December 11, 2022, from https://dutchreview.com/culture/history/netherlands-flat/
Cleland, B., & Walton, D. (2004, July 29). Why Don’t People Walk and Cycle? Central Laboratories. https://doi.org/https://can.org.nz/system/files/Why%20dont%20people%20walk%20and%20cycle.pdf
Cogan. (2022, July 18). Life and death on America’s deadliest road. Vox. Retrieved December 11, 2022, from https://www.vox.com/23178764/florida-us19-deadliest-pedestrian-fatality-crisis
Distance between Bethesda, MD and Washington, DC. (2022). Distance Between Bethesda, MD and Washington, DC. Retrieved December 11, 2022, from https://www.distance-cities.com/distance-bethesda-md-to-washington-dc
Gavin. (2020, July 1). What is the Average Commuting Bike Speed? | True Commuter. True Commuter. Retrieved December 11, 2022, from https://truecommuter.com/what-is-the-average-commuting-bike-speed/
Gilmore, M. (2014, August 30). District of Columbia Population History. District of Columbia Population History | Washington DC History Resources. Retrieved December 11, 2022, from https://matthewbgilmore.wordpress.com/district-of-columbia-population-history/
Los Angeles – Place Explorer – Data Commons. (2021). Los Angeles – Place Explorer – Data Commons. Retrieved December 11, 2022, from https://datacommons.org/place/geoId/0644000?utm_medium=explore&mprop=count&popt=Person&hl=en
Lusk, A. C., Furth, P. G., Morency, P., Miranda-Moreno, L. F., Willett, W. C., & Dennerlein, J. T. (2011, February 9). Risk of injury for bicycling on cycle tracks versus in the street. Injury Prevention, 17(2), 131–135. https://doi.org/10.1136/ip.2010.028696
Mesimäki, J., & Luoma, J. (2021, June 30). Near accidents and collisions between pedestrians and cyclists – European Transport Research Review. SpringerOpen. Retrieved December 11, 2022, from https://etrr.springeropen.com/articles/10.1186/s12544-021-00497-z
Montgomery County Maryland Capital Budget. (2022). Montgomery County Maryland Capital Budget. Retrieved December 11, 2022, from https://apps.montgomerycountymd.gov/BASISCAPITAL/Common/Project.aspx?ID=P500119&CID=3&SCID=8
Netherlands: modes of transport used to commute to work | Statista. (2019). Statista. Retrieved December 11, 2022, from https://www.statista.com/statistics/1013713/mode-of-transport-used-to-commute-to-work-in-the-netherlands/
Oss · Netherlands. (n.d.). Oss · Netherlands. Retrieved December 11, 2022, from https://www.google.com/maps/place/Oss,+Netherlands/@51.7640573,5.5206909,12.54z/data=!4m5!3m4!1s0x47c6fc89edf0a983:0xd870787dc357c409!8m2!3d51.7611801!4d5.5140482!5m1!1e3
Population of Cities in Netherlands 2022. (2022). Population of Cities in Netherlands 2022. Retrieved December 11, 2022, from https://worldpopulationreview.com/countries/cities/netherlands
Pucher, J., & Buehler. (2016). The American Journal of Public Health (AJPH) from the American Public Health Association (APHA) publications. American Journal of Public Health. Retrieved December 11, 2022, from http://ajph.aphapublications.org/
Rasmussen, N. (2021, May 12). Terrain Analysis of the 50 Largest Cities in the USA. ArcGIS StoryMaps. Retrieved December 11, 2022, from https://storymaps.arcgis.com/stories/93b6c503d423499d93731cd5966e620e
Schere, D. (2022, August 25). Bicyclist dies in crash on River Road in Bethesda. Bethesda Magazine & Bethesda Beat. Retrieved December 11, 2022, from http://bethesdamagazine.com/2022/08/25/collision-involving-a-bicycle-closes-part-of-river-road-in-bethesda/
Tinoco. (2019, January 3). 8 Amazing Bike Rides In Los Angeles. LAist. Retrieved December 11, 2022, from https://laist.com/news/transportation/8-amazing-los-angeles-bike-rides
About the Author:
 Matthew Smith, 2022-2023 Environmental Leader
Matthew is a Senior at Bethesda Chevy Chase High School and part of Bethesda Green’s Environmental Leaders Program. He has recently become very interested in sustainable city development, which includes making sure everyone has access to safe, low emission transit. He would love to encourage such transit and aide in its implementation here in Bethesda. He has always enjoyed spending time in nature and is ready to work towards a more sustainable future!


